
All XLOGP needs to perform the calculation is the chemical structure of the given molecule.
Usage: xlogp [-flag] input_file
The input_file contains the given molecule. If this file is not in the working directory, you can include the path in input_file (see the examples below). Please notice that the input file should be represented in Mol2 format. The current version of XLOGP does not accept input files in other format.
You have two flags to choose:
-s Calculate the logP value for a single molecule. That means the input_file contains only one molecule. This is the default running mode for XLOGP. You can also choose this mode by simply leaving the flag blank (see the examples below).
-m Calculate the logP values for multiple molecules. That means there are more than one molecule packed in the input_file. This running mode may be helpful when you try to screen a whole database of molecules.
Examples:
xlogp
../examples/test.mol2
xlogp -s
test.mol2
xlogp -m
multi_test.mol2
XLOGP v2.0 is really fast. If run on SGI O2/R10000 workstation, it can process approximately 100 medium-sized organic compounds per second.
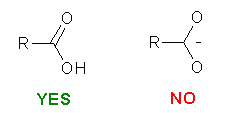
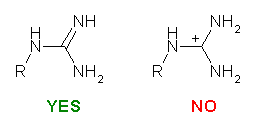
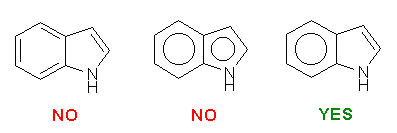
We recommend you to use SYBYL to prepare the input Mol2 file. While constructing the molecules, there are three things that should be kept in mind:


Please be careful while constructing the molecule. The most important thing is that you provide a "correct" representation of your molecule in Mol2 format because the following calculation will totally rely on it.. For example, if you violate the 2nd or the 3rd rule above, XLOGP could still give a logP estimation. However, it may deviate from the "real" value more or less.
If you do not have access to SYBYL, you could use some kind of conversion programs, such as BABEL, to convert your molecule into Mol2 format. Unfortunately, according to our own experience, conversion programs are not always 100% correct in assigning atom types.
After the calculation, XLOGP will put a short note on the screen. Besides that, XLOGP will also generate two output files to record the calculation results in detail. One is named as "xlogp.log" and the other is named as "xlogp.mol2".
"xlogp.log" records the results given by XLOGP calculation. It looks like this:
#
# XLOGP v2.0 logP calculation: Wed Jan 6 15:51:34 1999
#
# Name of molecule : Melatonin
# Molecular formula: C13H16N2O2
# Molecular weight : 232
#
----------------------------------------------
No. type symbol
contribution
----------------------------------------------
1 32 C.ar.h
0.337
2 35 C.ar.x
-0.151
3 34 C.ar
0.296
4 32 C.ar.h
0.337
5 35 C.ar.x
-0.151
6 32 C.ar.h
0.337
7 27 C.2
(pi>0)
0.013
8 24 C.2.h.x
(pi=0) 0.001
9 46 N.3.h
(ring) 0.545
10 5 C.3.h2
(pi=1) -0.008
11 73 O.3
(pi>0)
0.435
12 7 C.3.h2.x
(pi=0) -0.137
13 55 N.am.h
-0.096
14 28 C.2.x
(pi=0) -0.030
15 75 O.2
-0.399
16 2 C.3.h3
(pi=1) 0.267
17 3 C.3.h3.x
-0.032
----------------------------------------------
Calculated LogP = 1.56
The first several lines in this file give some general information of the given molecule. Then the following section tabulates each non-hydrogen atom in the molecule. In that table, the first column is the ID of a certain atom; the second column is the ID of its atom type; the third column indicates the symbol of its atom type; while the last column indicates its contribution to the logP value. This section will also list the correction factor if there is any. The last part of this file summarizes the calculation and gives an overall estimation of the logP value.
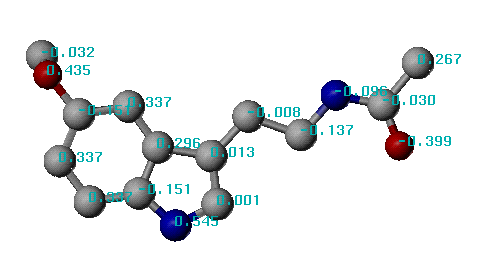
The other output file, i.e. "xlogp.mol2", is a Mol2 file. It is almost the same as the input Mol2 file. The only difference is that the atomic charges in the input Mol2 file have been replaced by the atomic contribution to the logP value (the last column in the following example Mol2 file).
@<TRIPOS>MOLECULE
Melatonin
33 34 1 1 1
SMALL
USER_CHARGES
@<TRIPOS>ATOM
1 C 1.3814
-0.2417 1.2012
C.ar 1 <1>
0.337
2 C 2.6525
-0.7744 0.9884
C.ar 1 <1>
-0.151
3 C 3.6832
-0.0072 0.4820
C.ar 1 <1>
0.296
4 C 3.5177
1.3371 0.1543
C.ar 1
<1> 0.337
5 C 2.2452
1.8870 0.3582
C.ar 1
<1> -0.151
6 C 1.1972
1.1088 0.8755
C.ar 1
<1> 0.337
7 C7 4.8298
-0.9843 0.4289
C.2 1
<1> 0.013
8 C8 4.3594
-2.1574 0.8892
C.2 1
<1> 0.001
9 N9 3.0973
-2.0264 1.2109
N.pl3 1
<1> 0.545
10 C10
6.2127 -0.6358
-0.0604 C.3 1
<1> -0.008
11 O11
2.0153 3.2261
0.0440 O.3
1
<1> 0.435
12 C12
7.2203 -1.8146
-0.0146 C.3 1
<1> -0.137
13 N13
8.5444 -1.4275
-0.4962 N.am 1
<1> -0.096
14 C14
9.5446 -2.3390
-0.5189 C.2 1
<1> -0.030
15 O15
9.3953 -3.4936
-0.1497 O.2 1
<1> -0.399
16 C16 10.8945
-1.8950 -1.0238
C.3 1
<1> 0.267
17 C17
1.7227 3.4471
-1.3443 C.3 1
<1> -0.032
.....
By using this Mol2 file, you can view the atomic hydrophobicity parameters directly in the SYBYL graphics interface. You can do this simply by choosing "Label charges ..." from the menu. Other potential applications may include calculating molecular lipophilicity potentials and incorporating it into 3D-QSAR analysis.

An example of XLOGP calculation results
[Content] [Introduction] [Download] [Compiling] [Usage] [Trouble Shooting]