Ground-penetrating radar (“GPR”) sends pulsed radio waves into the ground and receives them as they reflect back. As with radar or sonar, GPR waves are distorted when they encounter various materials—water, stone, bone, wood, metals, etc.—resulting in reflected waves that differ in shape and intensity depending upon what they “hit.” The reflected wave data is (computer) processed and recorded. When combined with the location of the readings, a two-dimensional map of the area can be composed, kind of like an aerial photograph of what’s under the ground. GPR is used for several purposes, but is perhaps most noted for accessing an area’s archeological significance much faster (and cheaper) than digging. (To learn more about GPR, check out, for example, the Ground-penetrating radar entry in Wikipedia).
In the context of this program, each surveyed site has a title. The surveyed area is always a grid, a two-dimensional, rectangular array of equal-sized square cells. For each cell that has been surveyed, we have its row number (starting at 0), column number (starting at 0), the intensity of the reading (from 1 to 600), and the time the reading was taken. Data for a cell in the gird area not (yet) surveyed is either not given, or appears as special values indicating the cell’s intensity is not yet known and the time is not applicable.
In this assignment, you complete a program to convert the GPR data from a text file (created by a download from a GPR field unit) into memory structures so that (already written) graphics routines can use it to produce an on-screen false color-coded map of the area surveyed, along with a report of the collected data. You gain practice with two-dimensional arrays and linked-list-based priority queues, a review of several programming concepts and Java features covered in ICS 21 and ICS 22, and an opportunity to make heavy use of pre-existing classes for which you have no source code—one of the most valuable of real-world programming skills. (This program is less sophisticated than a typical real-world GPR program, as this assignment is not about writing a full-blown GPR app; it’s about applying data structure and alogrithm concepts to an actual programming problem.)
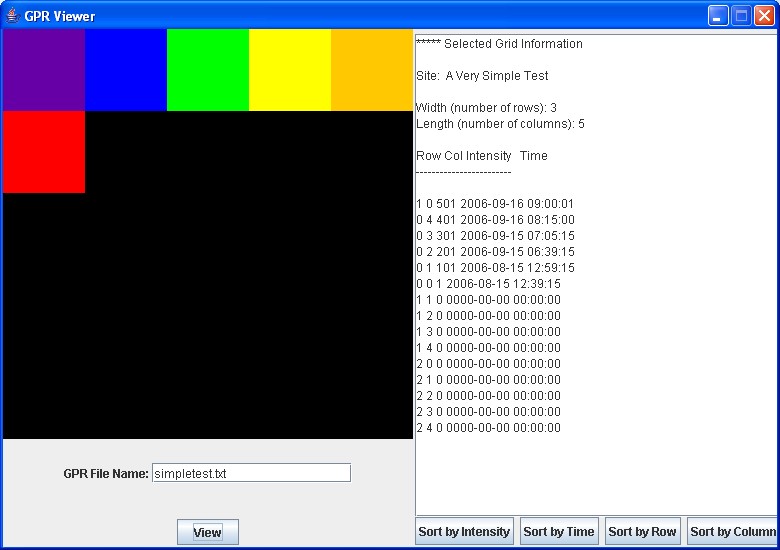
To view a GPR survey’s map and report, the user runs the GPR Viewer program GPR; this screen appears:
The user enters the name of a file in the GPR File Name: text box and presses the View button. If the file does not exist, an error message prints and the screen is otherwise left unchanged. If the file does exist, a color-coded map of the surveyed area appears in the map area above the file name and a text report containing survey information appears in the right-side window.
The program maps each cell to a position in the map area, corresponding to the cell’s row and column position in the grid. For instance, if the cell is at position (1,4) in the grid, it is displayed at position (1,4) on the map. The cell's size is set so that the grid fills the map window in at least one dimension—so if the survey area has few cells, each cell will be quite large. (Typically, each cell is relatively small compared to the survery area, so more precise readings of the area can be obtained.) Each cell is displayed in a color determined by its intensity; an intensity of 0 indicates the cell has yet to be surveyed, so the program leaves its cell unfilled:
| Intensity | Color |
| 0 | black |
| 1-100 | violet |
| 101-200 | blue |
| 201-300 | green |
| 301-400 | yellow |
| 401-500 | orange |
| 501-600 | red |
The report first displays the site name, the number of rows and the number of columns. It then lists each cell’s information, one cell per line. Note that the report has a line for every cell in the grid; if a grid was not surveyed, its intensity will be 0, and its time-stamp will be all zeroes.
When the report is first displayed, the cells are sorted by intensity (see below for details). The user can press any of the buttons Sort by Intensity, Sort by Time, Sort by Row and Sort by Column to place cell data in that so-named ordering. The sort orders are
Sort by Intensity: in order of decreasing intensity and, within each intensity value, sorted in ascending row order and, for each row, in ascending column order; unsurveyed cells that appear in the file are at the bottom of the list (as they have intensity 0)
Sort by Time: in order of decreasing time (that is, most recently surveyed items appear first) and, within each time, sorted in ascending row order and, for each row, in ascending column order; unsurveyed cells that appear in the file appear at the bottom of the list
Sort by Row: in order of ascending row number and, within each row, in ascending column order
Sort by Column: in order of ascending column number and, within each column, in ascending row order
To view another survey, the user just enters a new file name (and presses View). To exit, the user clicks on the window’s close box.
As previously discussed, we use Eclipse as our programming environment. Eclipse keeps each program in a project; projects are kept in a workspace, which also keeps track of all of your environment settings (including compile and runtime options).
Eclipse provides a large set of options and, unfortunately, the default settings aren’t entirely appropriate for us in this course. So, to keep things straightforward, you’ll all use the same workspace, one already set up with the appropriate settings for this course (and the same settings that will be used when grading your work). This workspace, as a ZIP file, is available at
A good place to put your workspace when working in the ICS labs is on your H: drive, so that it will be available to you regardless of which machine you're logged into, as well as being permanently stored (remember, files stored to the C: drive can be erased). For example, you might put your workspace into a folder named H:\23Workspace. You might also want to store it on a USB memory stick or other portable media, thus having a backup in case you lose the original.(Note to Mac users who intend to use Eclipse on their own machines: the zip archive may appear empty, because it contains only a folder called .metadata. Files and folders whose names begin with a "." character are hidden in Mac OS X by default. Go ahead and unzip the archive as discussed above; all will be well.)
All of the code that makes up this program is to be included in the UnearthingThePast project file; we’ve already included the project in the workspace you download. To complete the assignment, you add your code, that is, appropriate Java source files, to the source folder inside the project.
We’ve provided the code, as class files, that handles the graphic display of the map and report. You’ll find these files in the project’s lib folder.
You are to supply the code that reads the information from the GPR data file and prepares the grid; the grid contains the same information as the file, but in a form appropriate for use by the graphics routines the control the grid map. You also write the code that takes information from the grid and “massages” it into the GPR report; that report, as a (very long) string, is then “picked up” by the graphics routines when appropriate and displayed in the report window.
To help you write your code (and write it according to specification), we provide in the project, in the source folder, four Java source files. One has a class with the main() method, to get things going; the other three are interfaces to help ensure your code meets the required specifications. All these files are to be left unchanged. More specifically, the files are
GPR.java: the main progam; it also gives a brief description of the program
CellInfoInterface.java: an interface that describes and enforces some requirements for the cell class, which contains the information about one cell of the grid; you write the cell class
GPRGridInterface.java: an interface that describes and enforces some requirements for the grid class; you write the grid class
SurveyReportInterface.java: an interface that describes and enforces some requirements for the report; you write the report class
The exact format of the report is up to you, but it must (1) contain all the data that is in the GPR data file (2) be formatted so the site name, and number of rows and columns, appear at the top of the report, followed by cell information, with each cell’s information on one (and its own) line, and (3) be formatted so it is easy to read and locate specfic information (e.g., a user should be able to find the information about a particular cell quickly). You will lose points if your report is hard to read or understand.
Your program has to run within Eclipse's default memory allocations; in particular, this means you cannot increase the size of the heap or runtime stack. This restriction is to simulate the real-world situation where you are doing this work in the middle of nowhere. (This is a very real-world constraint: As-needed air drops in the middle of the Egyptian desert to deliver RAM to beef up your computer—it just doesn’t happen!) If your program runs out of memory while processing the provided test files (see below), your implementation needs improvement.
To sort the cells into a given order for the report, you must use a priority queue based on a singly-linked list. The PQ add operation is to be O(1); the delete operation is to be O(n). (Recall the O-value of a function is an upper bound—so you can make these operations faster than indicated, but no slower). You can write your own linked-list class, or adapt a linked-list class from a text, a web site that allows such adaptation of its code, or class notes from this or another course. If you adapt your list code from another source, be sure to cite your source in comments in your code—not doing so is considered plagarism! (Note you cannot use the Java LinkedList class, as it is based on a doubly-linked list.)
You must write your own priority queue class (which, of course, uses linked list class objects as appropriate).
The use of the priority queue as defined here provides what is essentially a sorting of the data via selection sort; the data is sorted in one of the four ways given above, depending upon which ordering the user chooses. There are several reasonable approaches for computing the priority; here are some hints and ideas:
One can compute each of the four priorities and store those priorities as part of the information that is placed into the queue at the time a cell’s information is inserted. Each cell is inserted only once, so this way each priority is only computed once.
An alternative approach is to determine the node’s priority during the delete operation; whenever a node is examined, the needed priority is computed from the node’s stored information. Since nodes may be queried several times in the course of deleting items to add to the report, this approach coud be quite a bit slower than the one discussed in the paragraph above, but it takes much less storage space—and storage space could be a somethig of concern if a data file has a large number (millions) of squares.
Removing items repeatedly from a priority queue produces items in decreasing order. If one wants to have the items in increasing order (and not violate the rules of priority queue deletion), “invert” the priority; for example, if the original priority is a number, multiply it by -1, or subtract it from a number larger than any legal value, to produce a new priority; that new priority will deliver the items in the reverse order.
A nice trick for computing a priority (a sort key) that is composed of multiple fields is to concatentate them into one long number or string, ordered from the first field to use to the last. For example, for the By Intensity ordering, one can make the priority be
// computed once : these do not change
shiftFactorForRow = 10 ^ (floor(log(numberOfColumns) + 1));
shiftFactorforIntensity = 10 ^ (floor(log(numberOfRows) + 1)) * shiftFactorforRow;

//computed for each node's priority
priority =  intensity * shiftFactorforIntensity + (numberOfRows - row) * shiftFactorForRow + (numberOfColumns - col)
Note the “-1” trick will not work with this approach.
One way to reorder a report’s information is to re-read the file or GPR in-memory structure that contains the data,, and placing it (back) into the priority queue. But reading data off of disk is orders of magnitude slower than reading things from memory, so it would be better not to re-read the file each time the report is reodered. And re-reading data from the GPR memory structure also takes time (though not as much as reading from disk)—but it is time you don't actually need to spend if you use this little trick: When you delete a node from the priority queue, don't actually delete it; instead, mark the node as deleted from the priority queue but leave it in the underlying list. If the user selects a diferent ordering for the same information, just go through the linked list (that is used to store priority queue data) and unmark the deleted items. Now all the original data is back into the queue without having to read it again from the file.
The project file contains some test files to help you debug your program; they (and only they) end in the txt extension. For example, here is what the file SimpleTest.txt produces:
The grid patterns these files produce should look like what their names imply. The files ending in BIG can take several minutes to process, so, obviously, use them once you have your program working on the smaller files.
You will note the report generated from these files is very poorly formatted; we did this purposely, to give you an idea of what not to do for your report. Your report showing the data from the test files should be much nicer, as described above. (Hint: Java has a String.format() static method that takes a pattern and a string and produces an output string that conforms to the format. This is a very powerful method that can format the output almost any way you could possibly want. You can find some details about format() in most any introductory Java book and in tutorials on the Web; complete documetation is available on the Java Platform, Standard Edition 7 API Specification web page; check out the String and Formatter classes.)
Obviously, the users of the this GPR program do not want to wait more than necessary to see a map and report; once the View button his clicked, the results need to display as quickly as feasible.
The main determiner of the speed of this program is how long the data files, especially the big files, take to process, and that depends mainly upon the priority queue implementation and the Java string classes we use. (You can improve the speed of the program a bit using other means, but do not focus on "micro-efficiencies"— if the speed increase is minimal (for example, a few milliseconds faster for a report that takes minutes to generate) and the resulting code would be harder to understand or maintain, do not implement that change; it is just not worth it! However, if you can make the priority queue faster by making a small, easy-to-understand variation, go ahead and do so. For example, there is a way (using a technique we discussed in class) to construct the list so that you never have to check for a null list when adding a node; that saves some constant time for each insertion that, across many insertions, could have up to a noticeable increase in speed.) You’ll learn about other, faster, implementations of priority queues later in the course. But, even with this exercise’s priority queue structure, the program can be made several times faster by using the right Java string class:
It turns out that main activity that slows down the program is constructing the report, which requires concatenating many, many pieces of information into one very long string, as the graphics routine that prints the report can only handle a single string as its input. If you use the standard String class, these concatenations takes a very long time. Strings are immutable; that is, they cannot change once assigned a value. So each time there is a concatenation, a new target string is allocated to hold the result, and the (large) concatenated string is copied into that new String object, a very time-consuming task.
However, Java also provides a StringBuffer class that produces objects that hold strings that can be modified: at any point in time, a StringBuffer object contains some particular sequence of characters, but the length and content of the sequence can be changed.
The principal operations on a StringBuffer are the append and insert methods, which are overloaded so as to accept data of any type. Each effectively converts a given datum to a string and then appends or inserts the characters of that string to the string buffer. The append method always adds these characters at the end of the buffer; the insert method adds the characters at a specified point.
For example, if z refers to a string buffer object whose current contents are "start", then the method call z.append("le") would cause the string buffer to contain "startle", whereas z.insert(4, "le") would alter the string buffer to contain "starlet". [Java StringBuffer API documentation, //download.oracle.com/javase/7/docs/api/]
Thus, append works like concatenation for Strings, except that the current string is extended instead of a new String being allocated; this is much, much faster.
If you nicely format each piece of the report as you append it to the report string [e.g., z.append(String.format(pattern,string to add))], your report will be nicely formatted when it appears on the GPR screen.
Potentially even better is StringBuilder:
...This class is designed for use as a drop-in replacement for StringBuffer in places where the string buffer was being used by a single thread (as is generally the case). Where possible, it is recommended that this class be used in preference to StringBuffer as it will be faster under most implementations.[Java StringBuilder API documentation, //download.oracle.com/javase/7/docs/api/]
The constructors, append() and insert() for StringBuilder work the same way as the equivalent StringBuffer methods.
The GPR program only uses one explicit thread— so try StringBuilder and see how well it works. The graphic routines sometimes call their own threads, which might interfere with StringBuilder; if so, revert back to StringBuffer. In no event, though, should you use String objects to build the report: Use StringBuilder if you can, StringBuffer if you must.
Documetation for String, StringBuffer and StringBuilder is on the Java Platform, Standard Edition 7 API Specification web page.
Zip up your project folder into the file UnearthingThePast.zip, and turn it in via Checkmate. Do not turn in the entire workspace—it’s quite large, and we already have a workspace set up for running and grading your program.