click for larger image
click for larger image
| click for larger image | click for larger image |
General Educational
Aims: This course will give students the opportunity to familiarize themselves
with principles and systems for information visualization. Specific emphasis will
be given to
- the critical discussion of the merits and demerits of various
visualizations for multivariate data and for information hierarchies,
- the
ease of users' interaction with these visualizations, and
- the recognition
of commonalities between systems and of success factors.
Specific Objective:
At the conclusion of this course, students will
-
be familiar with major research systems for the visualization of multivariate
data and information hierarchies
- realize the importance
of appropriate visualizations and the dangers of inappropriate visualizations
- realize the importance of interaction aspects when evaluating
visualizations
- be familiar with several commercial
applications
N.B.: This class does not deal with the visualization
of time, graphs (except strict hierachies), and scientific imaging.
Requirements: One of ICS 105, 186, 187, 205, 206, 227, 278 or 287 with a grade of B or better; otherwise consent of the instructor.
Character of the course: seminar with readings, presentations, lots of discussion, and a final essay.
Time and location: T Th 9:30-10:50 Physical Sciences Classroom Building 120 (a technoloy-enhanced classroom)
Readings:
Required:
Conference and journal articles collected in
[CMS]:
Stuart K. Card, Jock D. Mackinlay and Ben Shneiderman,
eds. (1999): Readings in Information Visualization: Using Vision to Think.
San
Francisco, CA: Moran Kaufmann Publishers. ISBN 1558605339.
[InfoVis]:
Proceedings of the IEEE Symposia on Information Visualization
[Ecomm]:
Proceedings of the 2nd ACM conference on Electronic Commerce October 17 - 20,
2000, Minneapolis, MN USA
[W]: Colin
Ware: Information Visualization: Perception for Design. Academic Press, ISBN 1-55860-511-8
Optional:
Robert Spence (2001):
Information Visualization. Addison-Wesley and ACM Press.
Chaomei
Chen (1999): Information Visualisation and Virtual Environments. London, New York
: Springer. ISBN 1852331364
Grading:
40% for two presentations (or 25% for one presentation and 15% for
homework on visual data mining)
30% for essay
30% for in-class participation
Efficient reading: see here
Cheating: see http://www.ics.uci.edu/~ucounsel/continuing_students/cheat.html
ICS Deadlines: Adding this course: 3 weeks ??
Dropping this course: 6 weeks ??
Course Notes: click on individual topics
below
Office hours: T Th 11-12 a.m. (contact me in class or send email beforehand)
| 280 Advanced Topics in Data Mining |
Course structure:
| Date | Topic | Discussion Chair | Source |
| 4/10 | Overview of Information Visualization I | Theresa Nguyen | CMS, 1-27 |
| 4/12 | Overview of Information Visualization II | Victor Gonzales | CMS, 1-27 |
| 4/17 |
W. Wright: Research Report: Information
Animation Applications in the Capital Markets | David Yucht | CMS 83-91 |
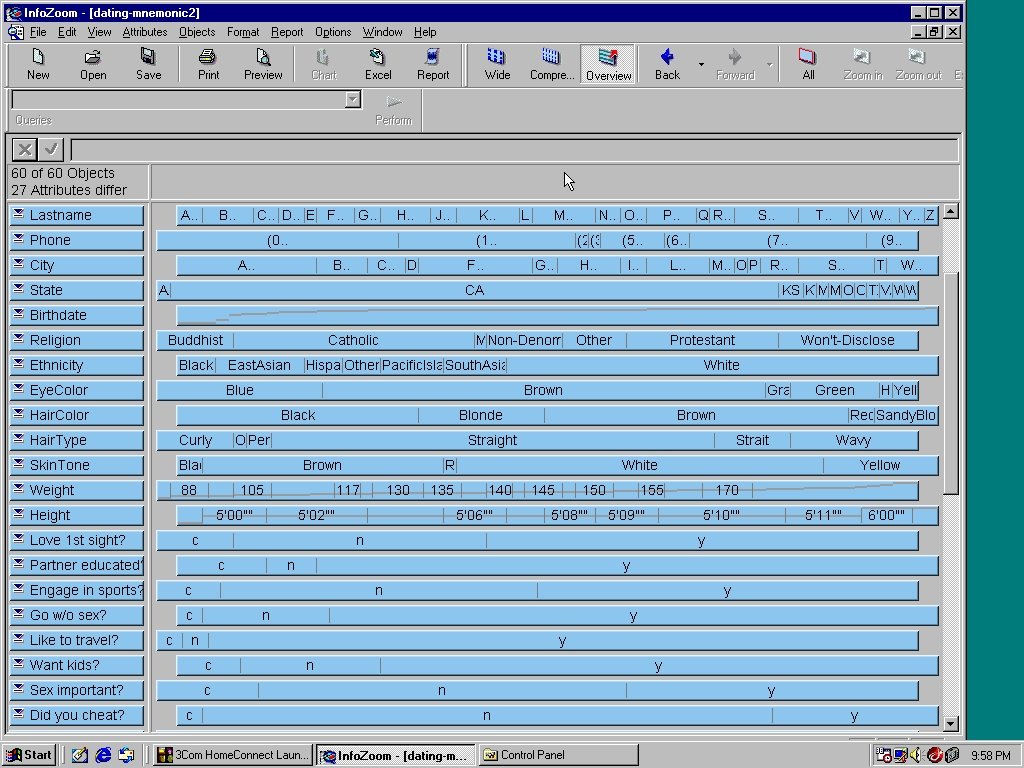
| 4/19 | Practical Demonstrations with Spotfire and InfoZoom | Alfred Kobsa | InfoZoom |
| 4/24 | D. Keim, H.-P. Kriegel: VisDB: Database Exploration Using Multidimensional Visualization | Naithili Narasimha | CMS 126-139 |
| 4/26 | A. Inselberg: Multidimensional Detective | Darren Gates | CMS 107-114 |
| 5/1 | B.
Johnson, B. Shneiderman: Tree-Maps: A Space-Filling Approach to the Visualization
of Hierarchical Information Structures | Wan Sze Ng | CMS 152-159 CMS 160-182 |
5/3 5/8 | B. Sheiderman: Dynamic
Queries for Visual Information Seeking C. Ahlberg, B. Shneiderman: Visual Information Seeking: Tight Coupling of Dynamic Query Filters with Starfield Displays E. Tanin, R. Beigel, B. Shneiderman: Research Report: Design and Evaluation of Incremental Data Structures and Algorithms for Dynamic Query Interfaces | Bhaskar Chatterjee Steven Tuttle | CMS
236-243 CMS 244-250 CMS 251-252 InfoVis'97, 81-86 here |
| 5/10 | H. Kumar, C. Plaisant, B. Shneiderman: Browsing Hierarchical Data with Multi-Level Dynamic Queries and Pruning | Dawit Yimam Seid | CMS 295-305 |
| 5/15 | R. Rao, S. Card: The Table Lens: Merging
Graphical and Symbolic Representations in an Interactive Focus+Context Visualization
for Tabular Information | Scott Castle | CMS 343-349 CMS 597-615 |
| 5/17 |
G. Robertson, S. Card, J. Mackinlay:
Information Visualization Using 3D Interactive Animation | Mzng Tang | CMS 515-529 W 298-302 |
| 5/22 | Applications
and Implications | Ming Bi | CMS
625-640 |
| 5/29 |
M. Spenke, C. Beilken: Visual, Interactive
Data Mining with InfoZoom – the Financial Data Set | Xianhong Bao | PDK99 (here) EC2000 (here) |
| May 30: Visual discoveries due | |||
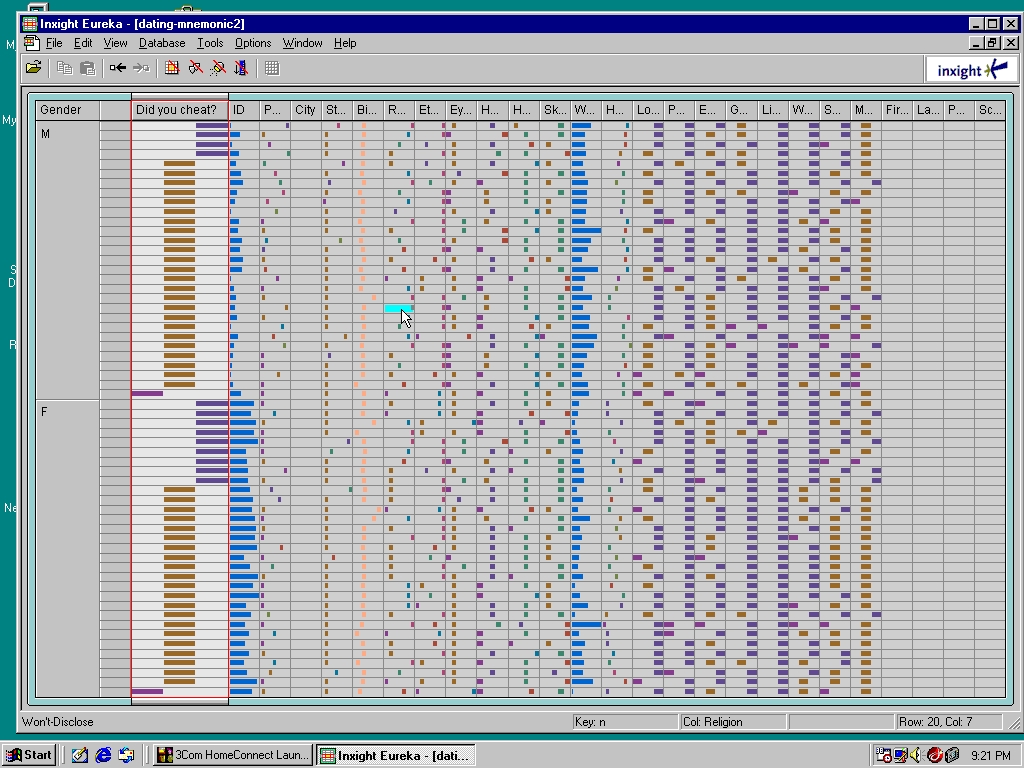
| 5/31 | Practical Demonstrations with Inxight Eureka | Chaonan Geng | here |
| 6/5 | C. Stolte, P. Hanrahan: Polaris: A System for Query, Analysis and Visualization of Multi-dimensional Relational Databases | Darren Gates | InfoVis'00 (here) |
| 6/7 | C. Ware: Visual Attention and Information that Pops Out | Alfred Kobsa ?? | W 151-75 |
| June 24: Essays due |
(*) This article must only be read by the presenter, not by the whole
class